Environmental Monitoring Station ROI: The Complete Cost-Benefit Guide
Priya Chen, a procurement manager at a mid-sized European city, spent four months trying to justify a 20-station environmental monitoring network to her finance committee. She had the vendor shortlists, the sensor specifications, and the installation quotes. What she didn’t have was a number the finance director would accept. Every return-on-investment figure she found was either air-quality-only, vendor-vague, or buried in a feasibility PDF written for a different country.
That’s the real bottleneck for environmental monitoring station ROI. Not the hardware, and not the sensors. The business case.
The technology has matured. Modern multi-parameter stations measure PM2.5, noise, and weather from one pole-mounted unit, connect over NB-IoT or LoRaWAN, and run for years on solar and battery power. The budget conversation hasn’t caught up.
This guide gives you the framework that conversation needs: real cost data, verified payback periods, and a calculation you can copy into a budget memo. By the end, you’ll know what a station actually costs to own, where the money comes back, and how to present the case so a finance committee says yes. If you’re already evaluating options, you can review Black Ant’s environmental monitoring station range at any point.
What Is Environmental Monitoring Station ROI?

Environmental monitoring station ROI measures the net value a monitoring network returns over its useful life, expressed as payback period, cost-benefit ratio, or internal rate of return. It equals the annual benefit from avoided costs and monetized public value, minus the total cost of ownership, divided into the upfront investment.
That definition matters because standard private-sector ROI math under-sells these projects. A commercial purchase returns money to one organization. A municipal monitoring network returns value to a whole community, across enforcement, public health, property, and reputation. Those benefits are diffuse, and some resist clean pricing.
So the honest approach is to build two numbers: a hard one from avoided costs you can defend, and a soft one from proxy values that makes the case complete.
Every business case needs three outputs:
- Payback period: how many years until cumulative benefit exceeds total cost
- Cost-benefit ratio: lifetime benefit divided by lifetime cost (a 10-year ratio of 1:7 means $7 returned for every $1 spent)
- IRR or NPV: the finance director’s preferred framing for comparing projects
You’ll rarely get all three right. Getting payback and a 10-year ratio right is usually enough.
How Much Does an Environmental Monitoring Station Cost?
Cost is where most business cases fall apart, because the spread is enormous. A regulatory-grade reference station runs five figures. A low-cost IoT unit runs in the hundreds. Neither number tells you what your network will actually cost to run.
The Three Cost Tiers
| Cost tier | Upfront (CapEx) per station | Annual operating (OpEx) | Typical 5-year TCO |
|---|---|---|---|
| Regulatory / reference-grade | $15,000 to $40,000 | $8,000 to $15,000 | $55,000 to $115,000 |
| Low-cost IoT multi-parameter | EUR 3,000 to EUR 4,500 | ~EUR 1,000 plus sensor renewal | ~EUR 7,000 to EUR 10,000 |
| Turnkey OEM multi-parameter | $3,100 to $4,500 | $500 to $1,500 | $6,000 to $12,000 |
The regulatory tier is what national agencies run for formal compliance reporting, and the figures come from a published cost-benefit analysis of continuous air quality monitoring. The low-cost IoT tier matches documented urban deployments like the Airqino network in Arezzo, Italy, where 11 multi-sensor units cost roughly EUR 35,000 to EUR 40,000 in total. The turnkey OEM tier reflects fully equipped Chinese stations, pole, solar, and display included, and it’s the tier where Black Ant competes.
The Hidden Costs Nobody Budgets For
The purchase price is the smallest part of a monitoring network’s real cost. Budget for all of these:
- Installation and site prep: pole, foundation, cable glands, lightning protection
- Power architecture: solar panel, battery, and regulator if the site has no mains supply
- Connectivity fees: monthly cellular data plans or NB-IoT/LoRaWAN tariffs per node
- Calibration labor: sensors drift, and field recalibration is recurring work
- Sensor replacement: electrochemical and particulate sensors have 1 to 2-year service lives
- Platform subscription: dashboard, alerting, and data management software
- Theft and vandalism: budget a contingency reserve, especially in exposed urban locations
A single-parameter approach inflates all of these. One multi-parameter station measuring PM2.5, noise, and weather replaces three single-purpose devices, which cuts installation labor, power requirements, and maintenance visits. The consolidation is where a lot of the payback comes from. For a deeper look at the sensor stack that drives these trade-offs, see our environmental monitoring station smart city deployment guide.
Real Payback Periods: What City Deployments Show

Payback figures on the open market range from a few months to over six years, and the spread tells you more than any single number. The common thread: environmental monitoring station ROI is short when monitoring is bundled with something that produces hard savings, and longer when the station’s only output is data.
| Deployment | Scale | Investment | Reported payback |
|---|---|---|---|
| Continuous air quality monitoring | 1+ stations | 15kto15kto40k per station | 18 to 24 months (vs periodic sampling) |
| Fort Collins, CO mobile network | School-bus sensor fleet | $285,000 | 2.8 years, from fine reductions and health savings |
| Mid-sized city IoT network (modeled) | 100,000 population | Network capex | 3 to 4 years, IRR 18.5 to 22.8% |
| European city LoRaWAN network | 400,000 population, 150 AQ sensors | EUR 2.5M (bundled network) | ~13 months, EUR 2.35M in annual savings |
A few notes so these numbers don’t mislead you.
The 18 to 24-month break-even for continuous air quality monitoring comes from the same EMSOL analysis cited above, and it works because continuous data catches violations that periodic sampling misses up to 50% of the time, creating enforceable, fine-avoiding evidence.
Fort Collins, Colorado reached a 2.8-year payback on a $285,000 mobile sensing network through pollution-control benefits, penalty reductions, and health insurance savings, with a lifecycle cost-benefit ratio estimated between 1:4.5 and 1:6.2. The modeled mid-sized city IoT network in China’s smart-city feasibility literature shows a 3 to 4-year payback at a 56% lower monitoring cost than manual methods.
Here’s the honest caveat. The 13-month European figure includes smart parking, street lighting, and waste collection alongside air quality. Pure air and noise monitoring “don’t have such a clear return on investment,” as Santander’s former mayor put it, because the data’s value is real but indirect.
When you build your business case, either bundle monitoring with savings-generating infrastructure or accept a longer, defense-based payback. Pretending a standalone network pays back in 13 months will get your proposal rejected.
The Full Value Stack: Six Benefits Standard ROI Math Misses
Most ROI models count one thing: avoided cost. That’s why they understate the case. The business case framework from Clarity for air quality monitoring identifies six value categories, and each one maps to a monitoring station network.
Regulatory and compliance value
Continuous, time-stamped data gives regulators defensible enforcement evidence. It identifies pollution hotspots, supports fines, and makes the “unrepresentative sample day” defense impossible. Every fine avoided is a hard number you can put in the memo.
Operational and decision-making value
Real-time data tells agencies when to issue health advisories, close outdoor spaces, or dispatch crews. A dense network that catches a localized event hours before a sparse federal network notices is a direct operational asset, not just a reporting tool.
Public health and community value
The World Health Organization estimates that a 10 microgram reduction in PM2.5 lowers respiratory disease incidence by about 7%. Chinese smart-city feasibility work puts the avoided medical expenditure from cleaner air at roughly 120 million yuan a year. Proxy-value these savings with a conservative figure and cite the health basis.
Property and economic value
Environmental monitoring coverage correlates with property values. A Shenzhen case study found an 8% real estate price premium in areas with monitoring coverage, because transparent data builds confidence in a neighborhood. Cities that can demonstrate good air quality attract residents and business.
Funding and reputational value
Accurate monitoring data strengthens grant applications and shows residents and stakeholders that the city manages its environment transparently. A funded pilot that produces clean data is easier to scale than a pilot with no data at all.
Advocacy and environmental justice value
Hyperlocal networks reveal pollution inequalities that city averages hide. Documenting a hotspot in a low-income district turns a political problem into an engineering one with a data-backed solution, which is exactly the argument that unlocks equity-linked funding.
For each category, you assign a defensible proxy value or score it qualitatively. You don’t need every number to be perfect. You need the finance director to see that the network returns value across all six, not just in energy or fine savings. That breadth is what turns the proposal into a defensible environmental monitoring station ROI case.
How to Calculate Environmental Monitoring Station ROI: A Worked Example

Here’s the calculation formula, in five steps, with a conservative worked example so you can see the numbers move.
- Sum your capital expenditure (CapEx). Hardware, installation, site prep, power system.
- Sum your annual operating expenditure (OpEx). Connectivity, calibration labor, sensor replacement, platform, contingency.
- Estimate annual avoided costs. Fines avoided, incident response saved, labor reallocated.
- Add proxy-valued public benefits. Health, property, reputation, environmental justice, using conservative figures.
- Compute the result. Payback = total CapEx divided by net annual benefit. Ten-year ratio = (net annual benefit x 10) divided by total CapEx.
Now the worked example: a mid-sized city planning 20 multi-parameter stations.
- CapEx: 20 stations at $4,000 each ($80,000) plus $20,000 for installation, poles, and power =∗∗100,000**
- Annual OpEx: $6,000 connectivity, $8,000 calibration labor, $4,000 sensor replacement, $5,000 platform = $23,000 per year
- Annual benefits: $30,000 avoided fines and enforcement, $15,000 faster incident response, $30,000 health proxy value, $15,000 grant and reputation value = $90,000 per year
- Net annual benefit: $90,000 minus $23,000 = $67,000
- Payback: $100,000 divided by $67,000 = about 1.5 years
- 10-year ratio: ($67,000 x 10) divided by $100,000 = 6.7 to 1
Those are deliberately conservative assumptions, and they land in the same range as the real-world ratios of 1:4.5 to 1:7.1 documented earlier. Adjust the benefit figures for your city’s violation history and health context, and run the model for a pilot phase first. A 5-station pilot de-risks the numbers before you scale to 20. For the sensor-accuracy and deployment detail behind those OpEx assumptions, see our outdoor IoT air quality monitoring station deployment guide.
Five Design Decisions That Move the ROI
The design decisions you make before purchase move your environmental monitoring station ROI more than the station price tag does.
Multi-parameter vs. single-parameter stations
One station doing PM2.5, noise, and weather beats three single-purpose monitors. You cut installation labor by up to two thirds, halve maintenance visits, and keep one data pipeline to manage.
Connectivity choice
NB-IoT, LoRaWAN, and 4G have very different data-fee profiles and coverage footprints. Match the protocol to the site. A dense urban core with good cellular coverage might run NB-IoT; a wide rural network with no per-device fees favors LoRaWAN. The wrong choice means years of excess connectivity spend.
Black Ant’s IoT data collection terminal aggregates multiple meters and sensors over RS485, M-Bus, or 4-20mA and uplinks over NB-IoT or LoRaWAN, so you’re not locked into one carrier.
Power architecture
Solar plus lithium battery removes the single biggest hidden cost for remote sites: grid power and trenching. A station that runs for six years on solar and battery has a fundamentally different OpEx curve than one that needs a mains connection and an electrician on call.
Calibration and replacement scheduling
Sensors drift, and the calibration calendar is recurring labor. Choose stations with modular sensor heads so a single PM2.5 sensor can be swapped without taking the whole unit offline. Plan for 1 to 2-year replacement cycles and put them in the budget from day one.
Buy vs. sensing-as-a-service
A subscription model that bundles hardware, calibration, software, and support into one annual fee, like Philadelphia’s $90,000-per-year, 76-sensor network, converts large CapEx into predictable OpEx. That’s often easier for a municipal finance office to approve, even if the lifetime cost is higher. Match the model to how your city likes to buy.
Building the Business Case for Municipal Budget Approval

The math is only half the job. How you present the environmental monitoring station ROI decides whether the committee approves it.
Phase the rollout. A pilot of 5 to 10 stations at high-exposure sites generates the local data that makes the scale-up number credible. Committees approve pilots far more readily than city-wide programs, and pilot data turns your modeled benefits into measured ones.
Align the case to the person approving it. The finance office wants payback and cost-benefit ratio. The sustainability officer wants the carbon and ESG story. Public works wants the O&M savings and alerting. Legal wants the fine-avoidance evidence.
One memo, four audiences, each section speaking to its reader.
Build in contingency. Vandalism, theft, weather damage, and supplier delays happen. A 10% reserve line item makes the plan look realistic rather than optimistic, and realistic plans get approved.
How Black Ant Lowers Environmental Monitoring Station TCO
Black Ant builds the station tier that most municipalities never see in a tender: turnkey OEM multi-parameter hardware priced for mid-market budgets, manufactured under ISO 9001 and exported with CE and RoHS documentation. For procurement teams comparing against premium European or US vendors, the practical effect is a total cost of ownership typically 40 to 65% lower for equivalent multi-parameter performance.
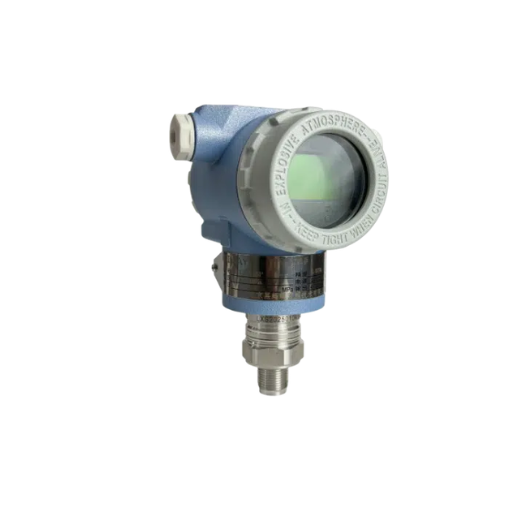
The environmental monitoring station measures air quality, temperature, humidity, wind speed, noise, and particulate matter, and it reports over NB-IoT or 4G from an outdoor IP65 enclosure, so it connects to your existing smart city platform without gateway conversion. Pair it with Black Ant’s edge data acquisition computer, which runs local processing and alerting on a six-year lithium battery, and the network stays operational through cloud or connectivity outages. Every unit ships with protocol documentation and commissioning support, because a station that integrates cleanly costs less to deploy and less to maintain.
We also manufacture to your specification. OEM and ODM orders come with custom labeling, packaging, and firmware configuration, supported from specification through first-article inspection, with NDA and IP protection on request. If you want to run your own business case against your actual station count and your city’s violation history, our application engineers will work the numbers with you.
Frequently Asked Questions

How much does an environmental monitoring station cost?
A regulatory-grade station costs $15,000 to $40,000 upfront plus $8,000 to $15,000 a year to operate. A low-cost IoT multi-parameter station runs EUR 3,000 to EUR 4,500, and a turnkey OEM multi-parameter station runs roughly $3,100 to $4,500 fully equipped.
The 5-year total cost of ownership ranges from about $6,000 to over $100,000 per station depending on the tier.
What is the payback period for air quality monitoring?
Continuous air quality monitoring typically breaks even in 18 to 24 months compared with periodic sampling, when enforcement and avoided fines are counted.
City-scale networks with bundled infrastructure report paybacks from 13 months to 4 years. Standalone monitoring networks generally land at the longer end of that range.
Do environmental monitoring stations save municipalities money?
Yes, in several ways: avoided enforcement fines, earlier pollution-event response, reallocated inspection labor, stronger grant positions, and proxy-valued public health and property benefits. The savings are real, but many of them are diffuse, which is why the six-category value framework matters.
How long do environmental monitoring sensors last?
The station enclosure and electronics are built for many years of outdoor service, but individual sensors are consumables. Particulate and electrochemical sensors typically need recalibration or replacement every 1 to 2 years. Budget replacement cycles as part of annual operating cost, and choose stations with modular sensor heads to keep the unit online during swaps.
Conclusion
Environmental monitoring station ROI is not a single number, and it won’t be found on a vendor brochure. It’s a five-part model: CapEx, OpEx, avoided costs, proxy-valued public benefits, and payback. Get those five right and you can hand a finance committee a defensible business case instead of a vendor pitch.
The three takeaways to carry into your budget meeting:
- Know your cost tier, and model the 5-year total cost of ownership, not the purchase price. The hidden costs, calibration, connectivity, power, replacement, are where the real money sits.
- Use the six-category value stack. Avoided fines and health, property, reputation, and equity benefits all belong in the memo, with conservative proxy values attached.
- Run the worked formula with your own numbers. A phased pilot turns modeled payback into measured payback, and measured payback is what gets a city-wide network approved.
The monitoring hardware is ready for a decade of service. The environmental monitoring station ROI case just needs to catch up. Run your city’s numbers through the model, then talk to a manufacturer who publishes the cost data instead of hiding it. Get in touch with Black Ant’s application engineers to build the case against real station pricing and real specifications. To learn more about Smart City Sensor Network Maintenance and Calibration: An Operations Guide, please click to refer to our accompanying guide. To learn more about Environmental Monitoring Station OEM Manufacturer China: How to Choose the Right Partner, please refer to our accompanying guide.