Edge Computing for Environmental Monitoring: How IoT Sensor Networks Really Work
In a city-wide environmental monitoring network, the cloud is the wrong place to do the real-time work. Send every raw PM2.5 reading, noise sample, and weather burst to a central platform and you inherit three problems: bandwidth you pay for but never use, latency you can’t afford during an air quality event, and total blindness the moment connectivity drops. The edge computing environmental monitoring IoT approach fixes this by processing data where it’s collected, before it ever leaves the station.
Wei Chen learned this the hard way. He manages air quality for a port city in eastern China, and his 30-station network routed everything through the cloud. When a construction site kicked up a PM2.5 plume, his dashboard took minutes to react. The sensors were fine; the readings were just traveling hundreds of miles and back to get processed.
Edge computing is already driving real market momentum. The market was valued at USD 61.2 billion in 2025, and roughly 10 million new connected environmental sensor units shipped in 2024 alone. But the practical question isn’t whether these networks work. It’s how you design one.
Most available guidance is academic papers or vendor hype, and neither shows you how to build a real system. This guide closes that gap. You’ll learn what edge computing means in environmental monitoring, how it stacks up against cloud-only processing, and a five-step process for designing a network that uses both well. If you’re scoping a project now, our edge data acquisition computer page shows the hardware specs that make on-device processing possible in the field.
What Is Edge Computing in Environmental Monitoring?

Edge computing in environmental monitoring means processing sensor data on or near the device that collects it. The station filters readings, computes values like AQI, and detects anomalies locally, then sends only meaningful results to the cloud.
That single change reshapes the whole architecture. Instead of a raw data pipeline that runs every sample to a server, you build a three-layer stack:
- Sensor layer: PM, noise, and weather instruments capture readings continuously.
- Edge layer: a local processor filters, aggregates, and detects anomalies on the node itself.
- Cloud layer: the platform stores archives, trains models, and runs city-wide analytics.
Environmental monitoring suits this model unusually well. Stations sit outdoors, often in solar-powered and battery-limited enclosures. They produce continuous streams over low-bandwidth links. And their most valuable outputs, AQI values and threshold alerts, are exactly the kind of thing a small processor can compute locally.
Think of the network as a nervous system. The cloud is the brain, good for slow city-wide decisions. The edge is the spinal cord: it reacts to a threat before the brain even knows. An edge AI sensor node with on-device inference demonstrates the pattern, reporting 94% inference accuracy at 0.87 ms latency while cutting transmissions by roughly 88% through event-triggered reporting.
The market is following the same logic. The environmental IoT sensor market is projected to grow from about 9billionin2025to9billionin2025to28.5 billion by 2034, a 12.8% CAGR, and fixed installations held 62% of that market in 2024, with Asia-Pacific leading at 38% revenue share. Most of those new nodes will process something locally.
For the procurement side of these networks, our smart city environmental monitoring station guide covers station selection and deployment. This article covers the architecture that makes them work.
Edge vs Cloud for Environmental Monitoring: A Practical Comparison
Every architecture decision comes down to one question: where does the processing happen? The table below compares the two extremes for an outdoor monitoring network. Real deployments sit between them, but the differences decide your latency, your data bill, and your behavior during outages.
| Criterion | Edge processing | Cloud processing |
|---|---|---|
| Latency | 10 to 50 ms; local alerting | 300 ms+ round trip, link dependent |
| Bandwidth | Filtered summaries, up to 86% less upstream data | Raw streams at sensor sample rate |
| Connectivity resilience | Keeps processing and buffering offline | Goes blind during outages |
| Power | Duty cycling and local logic extend battery life | Continuous transmission drains battery |
| Privacy / data sovereignty | Raw data stays local; summaries leave the node | Raw data leaves the jurisdiction |
| Cost | Lower data fees, more capable node hardware | Higher transmission and storage costs |
| Best for | Real-time alerting, remote and low-power nodes | City-wide analytics, model training, archives |
None of this makes the cloud obsolete. It stays the right home for cross-station correlation, model training, long-term archives, and regulatory reporting. The edge makes the cloud better by sending it clean, summarized data instead of noise.
Enterprise edge architectures follow the same pattern. EMQX, which runs distributed edge MQTT brokers across global facilities, describes edge rules triggering local controller responses in milliseconds with aggregation happening upstream. The pattern holds whether you’re managing a building or a city air quality network.
Five Benefits of Edge Processing in Environmental Sensor Networks

The benefits stack on top of each other. Cut the round trip and you also cut the data bill, the battery drain, and the outage risk.
Real-Time Local Alerting Without Cloud Dependency
Local threshold detection turns a 300 ms round trip into a sub-50 ms decision. In an ACM study of a smart construction site, moving video processing to the edge cut stream delay from 218.5 ms to 38.7 ms, an 82.3% improvement, and warning response from 402.7 ms to 51.2 ms, an 87.3% improvement. For a PM2.5 or water level event, that’s the difference between a live response and a post-incident report.
Lower Connectivity and Data-Transmission Costs
Bandwidth is the hidden cost of environmental IoT. In the same study, edge filtering cut bandwidth occupancy from 89.7% to 12.4%, an 86.2% reduction, while the system still handled 2.3 TB of sensor data. Market research estimates gateway-level filtering can cut upstream data egress by up to 40%. On NB-IoT or 4G, where every byte carries a fee, that math decides whether a network is affordable at city scale.
Resilience During Network Outages
Ingrid runs a 14-station network in a German region with patchy rural coverage. Before she added edge buffering, an overnight outage meant missing readings and a hole in her compliance archive. With local persistence and deferred upload, her stations recovered 99.83% of data through interruptions, versus 82.45% with plain TCP streaming. The network now treats outages as a feature, not an exception.
Longer Battery Life for Remote and Solar-Powered Nodes
Radio transmission dominates a node’s energy budget. Local processing means fewer and shorter transmissions, which is why duty-cycled edge devices last years on battery. Black Ant’s edge data acquisition computer runs on a 38,000 mAh lithium battery for up to six years at a two-hour collection interval, with standby current below 2 µA. Near-edge AI systems have reported 15 to 40% energy savings depending on the scenario.
Privacy and Data Sovereignty
Processing locally means raw sensor data never leaves the station. You send AQI values, alerts, and daily summaries, not the underlying stream. For municipal contracts with data-sovereignty clauses, that is a compliance advantage as much as a technical one.
How Edge Computing Works in a Real Environmental Monitoring Station
A station that processes data at the edge is not a different product. It’s the same instruments with the computing moved closer to them.
The Sensor Layer: What Gets Measured
Multi-parameter stations combine PM2.5 and PM10, NO2, CO, O3, VOC, noise, temperature, humidity, wind speed, and rainfall into one pole-mounted unit. Each channel produces a continuous stream that the edge layer must make sense of.
The Edge Layer: Local Processing and Inference
The local processor turns a raw stream into decisions. TinyML models run on low-power MCU-class hardware, the same class used in edge AI nodes that hit 94% accuracy at 0.87 ms. Concretely, the node handles four data types at the edge:
- Raw sensor readings: validated and filtered for noise and sensor drift before anything leaves the station
- Derived metrics: AQI and rolling averages computed from particulate and gas data
- Anomaly flags: threshold crossings and unusual patterns detected on the node itself
- Event summaries: the compact packages that actually get transmitted upstream
The Uplink: Sending Summaries, Not Streams
This is the “send summaries, not streams” principle. A station transmits a daily AQI summary plus threshold alerts over LPWAN links such as NB-IoT, LoRaWAN, or 4G, rather than a raw second-by-second stream. Protocol choice matters: MQTT suits platform push, while Modbus, RS485, and M-Bus handle local data acquisition from meters. For the full protocol trade-off, see our NB-IoT vs LoRaWAN for smart city environmental sensors comparison.
Power Architecture for Field Deployment
Solar panels feed a lithium battery, the node sleeps in microamp standby, and every millisecond of radio is budgeted. Outdoor enclosures carry IP65, IP67, or IP68 ratings so the electronics survive rain, dust, and heat. In this design, battery life is a planning parameter, not an afterthought.
Edge Computing Use Cases in Environmental Monitoring

The architecture matters most where the network is large, remote, or safety-critical.
Smart City Air Quality Networks
A mid-size city deploying edge-enabled multi-parameter stations can have each station compute local AQI and push threshold alerts in milliseconds. Only summaries and alerts reach the central dashboard, which cuts data fees and keeps up with the monitoring density demanded by frameworks like the EU’s Ambient Air Quality Directive (AAQD 2023/2119). The WHO air quality guidelines provide the health basis for why that real-time data matters.
Flood and Water-Level Pre-Warning
Municipal drainage teams in coastal Southeast Asia are using smart manhole covers with local water-level logic. Arun leads drainage operations for a coastal Thai city, and his crew relies on the covers’ threshold alerts through monsoon season. When heavy rain raises a sewer level past its limit, the cover pings the maintenance crew in real time without a round trip to the cloud. Arun estimates the extra lead time at 15 to 20 minutes per event, enough to clear a road or dispatch a pump truck before flooding starts.
Industrial Perimeter and Construction Site Monitoring
Edge nodes monitoring dust and noise at site boundaries deliver the 82 to 87% faster warning response from the ACM study. That gives a construction firm compliance evidence and incident prevention in one deployment, which matters wherever dust and noise limits are actively enforced.
Remote and Off-Grid Environmental Monitoring
Some sites have intermittent connectivity by design: valleys, coastal zones, and forest boundaries. A solar-powered edge node with local buffering keeps measuring and alerting through the gap, then syncs summaries when the link returns. This is exactly where the 99.8% data-integrity behavior earns its keep.
Designing an Edge-Enabled Environmental Monitoring Network: 5 Steps
Apply this sequence to your next smart city sensor network. It works for a 5-station pilot and a 200-station city build.
Step 1: Define the Data You Actually Need
Start with the decisions your network must support: public AQI reporting, regulatory compliance, flood warnings, or all three. Every decision you don’t need is data you can keep local. Write the required outputs down before you choose a single component.
Step 2: Select Edge Node Hardware for the Environment
Match hardware to the site, not the brochure. Outdoor street and rooftop stations need IP65 or better enclosures, solar input, and battery capacity sized to the sampling interval. An IoT data collection terminal can aggregate multi-protocol field devices over RS485, M-Bus, or 4-20 mA before the uplink.
Step 3: Plan Power and Connectivity
Choose the uplink by coverage economics, not preference. NB-IoT suits dense urban coverage with low data fees; LoRaWAN suits private networks across wide areas. Size the battery for the worst month, not the average. A node that dies in winter is a node that fails its purpose.
Step 4: Configure Local Processing and Alert Thresholds
Define what the node computes locally: AQI, rolling averages, anomaly flags, and threshold alerts. Set the thresholds in the field so a station reacts without asking the cloud first. The alerting logic lives at the edge; the analysis lives in the cloud.
Step 5: Integrate with the Smart City Platform
Upstream, the edge sends clean summaries over MQTT to the city platform. The platform handles cross-station correlation, long-term archives, and GIS dashboards. Done well, the integration makes the platform simpler, because it no longer has to ingest and clean raw sensor noise.
How Black Ant Builds Edge-Ready Environmental Monitoring Hardware
Edge computing only works when the node hardware can actually sustain local processing outdoors. That’s where Black Ant focuses.
Black Ant’s edge data acquisition computer processes sensor data in milliseconds without cloud dependency. It delivers 10 to 50 ms end-to-end latency, on-device AI inference, RS485, M-Bus, and 4-20 mA inputs, a 38,000 mAh lithium battery for six years of operation at a two-hour collection interval, IP68 protection, standby current below 2 µA, and OTA firmware updates.
The environmental monitoring station range measures air quality, temperature, humidity, wind speed, noise, and particulate matter, uplinks over NB-IoT or 4G, and ships in IP65 outdoor enclosures compatible with smart city platforms. Black Ant’s IoT data collection terminal aggregates multi-protocol inputs with NB-IoT or LoRaWAN uplink in an IP67, low-power package.
These are manufacturer specs, and they’re the difference between a whiteboard architecture and a network that runs for years unattended. For integrators and private-label brands, Black Ant also offers OEM and ODM options, and our smart city IoT infrastructure sensor manufacturer guide covers the full sourcing process for larger builds. If you’re scoping an edge-enabled network, our application engineering team can map your site conditions to a specific configuration.
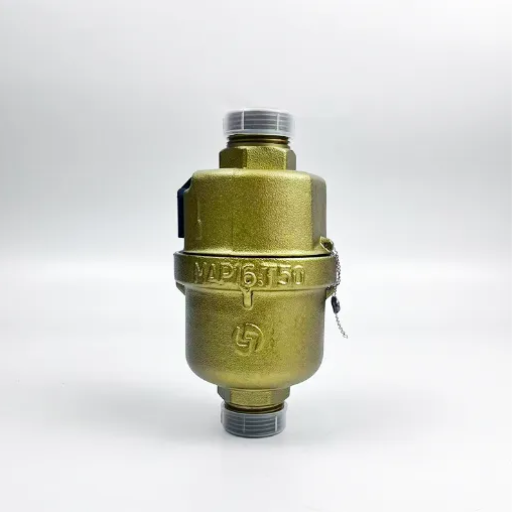
Black Ant’s IoT water meters, smart manhole covers, and environmental monitoring stations are designed for large-scale urban infrastructure deployments, delivering the data density and remote monitoring capability that modern smart city platforms demand.
Frequently Asked Questions

What is edge computing in environmental monitoring?
Edge computing in environmental monitoring means processing sensor data on or near the device that collects it. The station filters readings, computes values like AQI, and detects anomalies locally, then sends only meaningful results to the cloud.
Why is edge computing important for IoT?
Because most IoT data is time-sensitive and bandwidth-constrained. Processing near the sensor cuts latency, reduces transmission costs, keeps working during outages, and extends battery life. By 2027, IDC projects that 60% of new enterprise AI workloads will include an edge inference component.
Edge vs cloud for environmental monitoring: which is better?
You need both. Edge handles real-time detection and alerting where the station is; cloud handles city-wide analytics, model training, and archives. The design question is what to process where, not which to choose.
How long do edge environmental monitoring devices last on battery?
With duty cycling and local processing, multi-year operation is standard. A solar-fed edge computer like Black Ant’s runs up to six years on its 38,000 mAh lithium battery at a two-hour collection interval, with standby current below 2 µA.
Conclusion
Edge computing moves filtering, detection, and alerting into the sensor network itself. That one change cuts latency, bandwidth, power use, and outage risk at the same time, and it’s why modern smart city networks are built edge-first.
Three takeaways should stick with you. First, decide what to process at the edge versus what to send to the cloud, and use a comparison like the table above to make that call. Second, remember the math: up to 86% less upstream data, 82 to 87% faster alerting, and 99.8% data integrity through outages. Third, the hardware matters, and sub-50 ms edge computers with six-year battery life are what make the architecture real.
If your next project is an edge computing environmental monitoring IoT network, start with the hardware that makes it viable. Explore Black Ant’s Edge Data Acquisition Computer to see the specs, or review the environmental monitoring station range to plan the sensor side. Both pages include the details you need to compare against your site conditions.