GIS CMMS Work Order Integration for Sewer Utilities
An alarm that lives only on the map never gets fixed. A work order that lives only in the CMMS never finds the right cover.
Sewer utilities run two systems of record, and the whole game is the sentence between them. The GIS knows where every manhole is and what it is. The CMMS knows what work was done, by whom, and when. GIS CMMS work order integration is the discipline of connecting those halves so a sensor alarm becomes a dispatched job and a closed job returns as accurate map data.
Most programmes don’t stall on the software. They stall on the loop. The alarm fires, the map updates, and then nothing happens, because nothing raised a work order against the right asset.
By the end of this guide you’ll be able to design the full loop: how a manhole alarm becomes a work order on the right cover, the three ways to connect a GIS to a CMMS and how to choose, the alarm-to-priority mapping that keeps crews trusting the system, the close-out write-back that keeps the map honest, and the stage-level time-to-repair metrics that justify the programme. For the wider pipeline from cover to map, our field-to-map GIS integration guide covers the architecture around it.
Building the loop this quarter? Download the GIS-CMMS Work Order Mapping Kit → It contains the alarm-to-template-to-priority sheet and the integration-path decision guide described below.
What GIS-CMMS Work Order Integration Means for Sewer Utilities

GIS CMMS work order integration is the bi-directional link that turns a GIS map feature into a CMMS work order and writes the completed work back to the map. The GIS supplies asset identity and location. The CMMS supplies the work record. Integration keeps the two consistent as alarms arrive and jobs close.
That definition covers the mechanism. Governance decides whether the programme succeeds, and two rules sit underneath every working loop.
- The GIS owns where and what. It holds the asset identity, the geometry, the attributes, and the maintenance history reference.
- The CMMS owns what work, by whom, when. It holds the work order, the crew, the schedule, the close-out, and the cost.
Don’t ask either system to do the other’s job. Consolidating everything into one database usually produces a worse map or a worse maintenance record, because the two systems answer different questions.
The closed loop fits in one line: sensor alarm → GIS feature → work order → crew → close-out → GIS again. Break it anywhere and you get a map that looks alive but produces no work. A GIS that displays alarms nobody can dispatch is a screensaver with a budget.
The shift this supports runs from calendar-based maintenance, which sends a crew to every cover on a rotation, to condition-based maintenance, which sends one when a device reports a condition. A condition with no route to a work order is just a log entry.
Why the GIS-CMMS Loop Breaks (Four Failure Points)
The loop fails in four ways, and three of them are asset-identity problems rather than software problems. That moves the fix from the integration platform to the data model.
Failure 1: duplicated work orders
One storm, one asset, twelve work orders. This happens when every alarm creates its own work order with no deduplication upstream. A cover that reports tilt, then water level, then a repeated tilt inside ten minutes has produced three events and, without a rule, three jobs.
Failure 2: stale “open” alarms
A crew closed the job in the CMMS, but the status never wrote back, so the GIS still shows an active alarm. Weeks later, another crew attends a cover that was already fixed, because the map said it was still open.
Failure 3: orphaned work orders
The alarm carried a device ID that never resolved to a GIS asset, so the work order references nothing. It sits in the CMMS as a location-less record, and it is the failure that quietly corrupts a year of asset history.
Failure 4: asset-scope mismatch
The GIS counts manholes. The CMMS counts “work locations.” The two registries drift apart over a year until a report cannot reconcile them, and nobody trusts either number.
These four arrive together, which is what happened at Fairbrook Water Authority.
Fairbrook operates roughly 1,800 covers with 350 instrumented, running IBM Maximo against ArcGIS. Priya Raman, the maintenance superintendent, watched the network’s first serious storm generate about 60 work orders for about nine physical covers, because every alarm had created a job.
Then came the second problem. Once the duplicates were cleared, close-out status still never wrote back, and the GIS displayed “open alarm” on covers crews had already inspected for weeks. The integration worked. The governance didn’t.
The takeaway: fix only the plumbing and you have automated the chaos. Connectivity is necessary and nowhere near sufficient.
The Closed Loop, Step by Step
Here is the sequence in the order that avoids rework, with steps 1 to 3 where most programmes are actually built.
- The alarm fires on the cover or the edge node. A tilt, a lid-open, a water level, or a gas excursion triggers the event. An edge node that classifies alarms locally before the payload is built keeps noise out of the CMMS at the source.
- The alarm is normalised and de-duplicated. Repeated events from one situation collapse into one alarm, and our MQTT to GIS middleware guide covers the broker mechanics that do it.
- The alarm is resolved to a GIS feature through the device registry. This step decides whether the work order lands on the right cover.
- A work order is created, automatically for safety-critical alarms and held for human approval for the rest, carrying the asset, the location, and the severity.
- The work order is dispatched to a crew through ArcGIS Field Maps, ArcGIS Workforce, or the mobile client of your CMMS.
- The crew executes and closes the work in the field.
- Close-out status and the updated condition write back to the CMMS, then to the GIS.
- The work history stays attached to the asset so future risk ranking has something to rank.
Resolving the alarm to an asset: the join key that makes step 3 possible
Everything in steps 4 to 8 depends on one mapping: the device registry that translates a device ID into a FACILITYID. Without it, an alarm cannot raise a work order against the correct cover, and failure 3 becomes inevitable.
The registry needs one detail that is easy to omit and expensive to retrofit: install and removal dates. Hardware gets swapped and covers get replaced. If the registry doesn’t record when a device left an asset, a later swap silently attaches history to the wrong cover, and the error stays invisible until an audit.
The schema itself is the subject of our manhole asset management GIS data model guide. Here the concern is narrower: the CMMS work order must reference the same asset ID the registry resolves to, or the two systems describe different objects.
Three Ways to Connect GIS to a CMMS

Three architectures are real, and the choice depends less on technology preference than on utility size and GIS maturity.
| Path | Best for | Asset of record | Typical effort | Watch-out |
|---|---|---|---|---|
| 1. GIS-native CMMS (Cityworks, Cartegraph) | Mid-size utilities with a strong Esri geodatabase and no existing EAM | The geodatabase itself | Lowest integration effort; highest vendor lock | Data drift is minimal by design, but you’re committing your maintenance future to one stack |
| 2. API / middleware bridge to an enterprise EAM (Maximo via OSLC/REST, Lucity, SAP PM) | Large utilities that already run an enterprise asset-management system | The EAM, synced field-by-field | Highest effort; needs a sync layer and reconciliation reporting | Every synced field is a place for drift; you must report created, updated and orphaned records |
| 3. Event-driven trigger (IoT alarm → middleware → CMMS API) | Any utility that wants a sensor to raise a work order without a human | The EAM or GIS-native CMMS, depending on path 1 or 2 | Moderate; sits on top of path 1 or 2 | It multiplies whatever governance you already have, good or bad |
The first path makes the map the source of truth. Cityworks is built this way: it treats the Esri geodatabase as the authoritative asset inventory, lets a user select features on a map and create what its documentation calls an attached work order, and pushes GIS fields into the work order before updating the GIS on close-out. The Cityworks help documentation is the reference for the mechanic. This cluster’s reference configuration, Pinewood Water Utility, runs ArcGIS Online with Cityworks and a small work-order template set, which keeps map selection and close-out inside one system.
The second path keeps two systems and joins them. It is the enterprise default, and its core lesson, from the Las Vegas Valley Water District Maximo programme, is to integrate at the specific-asset level rather than by broad geography. Asset-level integration enables maintenance history, failure analysis and lifecycle costing; aligning by area gives you none of it. Geonexus states the loop plainly: crews close out work in the field, and the status should also update in GIS, closing the loop that makes the workflow possible.
The third path lets a manhole sensor create a work order with no human in the middle. It sits on top of whichever of the first two you chose and is covered mechanically in our MQTT to GIS middleware guide.
A decision rule, in three lines: a mature geodatabase with no enterprise EAM points to path 1. An existing Maximo, Lucity or SAP PM deployment points to path 2, with budget for reconciliation. Once either works, add path 3 so alarms raise work without a dispatcher.
For a smaller municipality the counter-intuitive answer is that a GIS-native CMMS usually beats a bespoke integration project. A small team running QGIS and PostGIS with a real-time sensor feed can add a lightweight work-order table and close a serviceable loop without funding an enterprise programme it can’t maintain.
Not sure which path fits your network size? Talk to our application engineers → and we’ll walk the three paths against your current stack.
Mapping Manhole Alarms to Work Orders
An alarm means nothing to a crew until it becomes a work order with a template and a priority. This mapping is the piece most programmes skip, and it decides whether crews trust the system.
Manhole alarms fall into four families: tilt or lid-open, water level, gas (methane and hydrogen sulphide), and loss of communication. Each deserves a different template and priority.
| Alarm type | Work order template | Default priority | Target response |
|---|---|---|---|
| Tilt / lid-open | Investigate structural and cover condition | High | Same day |
| Gas threshold crossed (CH₄, H₂S) | Confined-space entry and atmospheric check | Emergency | Immediate, with entry permit |
| Water level above threshold | Inspect surcharge, schedule cleaning/inspection | Medium, storm-linked | Next scheduled window, escalated during storms |
| Loss of communication | Condition check and device diagnostic | Low | Within the routine cycle, not an emergency |
The rule that prevents failure 1 is one open work order per asset. A new alarm doesn’t create a new work order; it annotates the existing open one. Fairbrook adopted this rule alongside the table above, and the storm that had produced 60 jobs now produces one job per cover, with later alarms logged against it.
Note the last row: a loss of communication isn’t an emergency. Treating a dead battery like a gas reading trains crews to ignore priority, and once they do, the whole system is theatre.
The mapping also covers the manual case behind the long-tail query “create work order from gis map feature”: make the layer selectable, select the feature, choose Create then Work Order, and let the CMMS populate the asset group and type from the geodatabase.
Keeping a human in the loop below the emergency tier is what earns trust. Auto-create the gas and structural alarms, queue the rest for a supervisor, and a priority stays credible.
Field Close-Out and Write-Back to GIS

The loop closes only when the field result returns to the map. What needs to write back is status, the work performed, and the updated asset condition. In several GIS-native platforms there is also an explicit “update map” flag that governs whether a close-out pushes to the GIS, and it is worth knowing which fields it controls.
Mobile close-out is the norm now. ArcGIS Field Maps and Workforce let crews receive assignments, complete the work and update the record offline, with the update synchronising on reconnection. The CMMS mobile client does the same.
Failure 2, the stale open alarm, is almost always a write-back that was never configured. It’s usually one field, set once, rather than a rebuild. Before adding covers, confirm that a closed work order actually changes the asset’s status on the map, and test it with one cover and one job.
Once write-back works, the collected history becomes audit material. Every status change carries a timestamp, so the map can replay what a cover did over the season, which is the capability our time-enabled feature layer guide describes. That history is what a council report on response performance draws from.
Measuring the Loop: Time-to-Repair and Crew Metrics
If you measure one number, measure it at the stages, not in total. Total time-to-repair hides the stage that is slow, and the slow stage is the only thing worth fixing.
Break the loop into four stages and time each one:
- alarm → triage: how long before a rule or a human decides this is a real job
- triage → dispatch: how long before it reaches a crew
- dispatch → arrival: how long the crew takes to get there
- arrival → close: how long the repair itself takes
At Fairbrook, the stage-level view showed the gains were not in the repair, which crews were already good at, but in the first two stages: triage and dispatch collapsed once alarms raised work orders automatically and the priority table replaced a manual decision. This is a composite illustration, but the shape is what to expect. Automation compresses the front of the loop, not the middle.
Four metrics keep a programme honest:
- MTTR (mean time to repair), the full loop, reported with its stage breakdown
- first-time-fix rate, the percentage of jobs closed without a return visit
- proactive-to-reactive work-order ratio, the direction condition-based maintenance should move
- alarm-to-work-order conversion rate, the percentage of alarms that produce a legitimate job, which exposes deduplication failures and false positives alike
These numbers defend the budget, because they translate an integration project into maintenance outcomes. The manhole monitoring ROI case makes the same argument from the cost side, connecting time-to-repair savings to the business case for instrumenting the network.
Conclusion
The loop is the product. A cover that reports and a CMMS that schedules are both necessary, and neither is sufficient until a work order lands on the right asset and the close-out returns to the map.
- Two systems of record, on purpose: the GIS owns where and what, the CMMS owns what work, by whom, when, and the join key connects them.
- Three of the four failure points are asset-identity problems, so the fix usually lives in the device registry and the work-order rules, not the API.
- Choose your path by size and maturity: a GIS-native CMMS for mid-size utilities, an API bridge for enterprise EAMs, and an event-driven trigger on top of either.
- Map every alarm family to a template and a priority, and enforce one open work order per asset.
- Measure at the stages, because automation compresses triage and dispatch rather than the repair.
Start with two checks: confirm the join key resolves a device ID to a FACILITYID, and confirm a closed work order writes back to the map. Those catch failures 2 and 3 before you add a single cover.
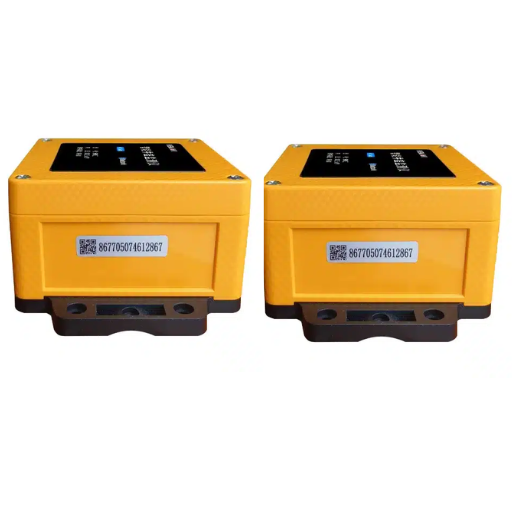
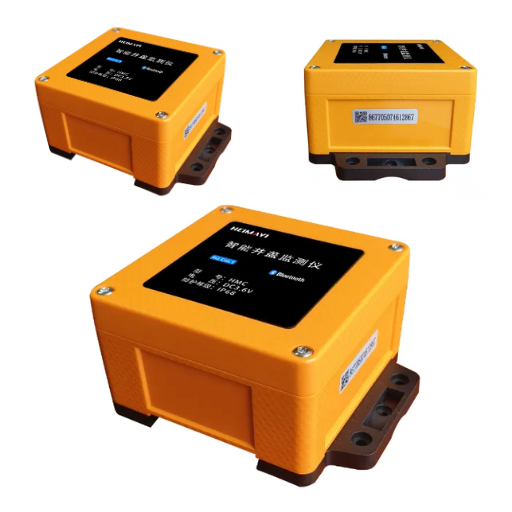
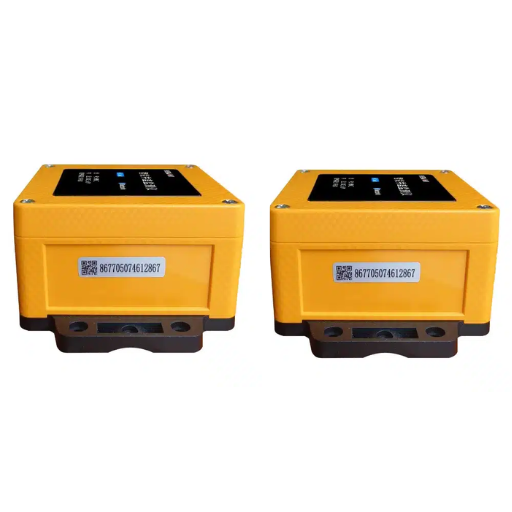
The devices that start the loop are the ones we build. Black Ant’s Smart Manhole Cover reports tilt, lid-open, water level, gas and temperature with the asset identifier in the payload, and the IoT Data Collection Terminal aggregates and classifies events before they reach your CMMS. Read the full field-to-map GIS integration guide for the architecture around them, or talk to our application engineers about designing the loop for your network. Asset-management governance for the programme as a whole is framed in ISO 55000.