Smart Manhole Cover ROI: A Municipal Cost-Savings and Payback Guide
The public works director pushed the proposal across the table. “Fifty thousand for smart manhole covers,” one council member read. “What’s my payback?” The director did not blink. “Eighteen months if we prevent one downtown overflow. Three months if we include labor savings. And if we don’t deploy it? The next CSO cleanup averages forty-seven thousand dollars, plus whatever the EPA decides to fine us.” The vote passed 7-0.
Probably you too have sat in some room like this. That is how it goes with municipal budgets. City councils don’t take to the notion of “smart city” spending.
And yet, the ROI math for smart manhole covers is clear. The costs of doing nothing are being felt in your maintenance budgets, your overtime accounts, and your regulatory correspondences. This guide is intended to give city public works directors, utility engineers, and smart city project managers with a complete conservative financial framework, i.e. actual municipal cost data, three worked scenarios, and ideas that will survive city council scrutiny.
This session will cover the following: brief unit cost (including hidden) with savings and dollar breakdown; ROI for pilot-scale development to city scale with three scenarios; commonly missed costs from a budget; and-building a business case that gets approved.
What Smart Manhole Covers Actually Cost

For most current ROI projections for smart manhole covers, the ownership cost seems to be underestimated. Let’s put this issue to rest.
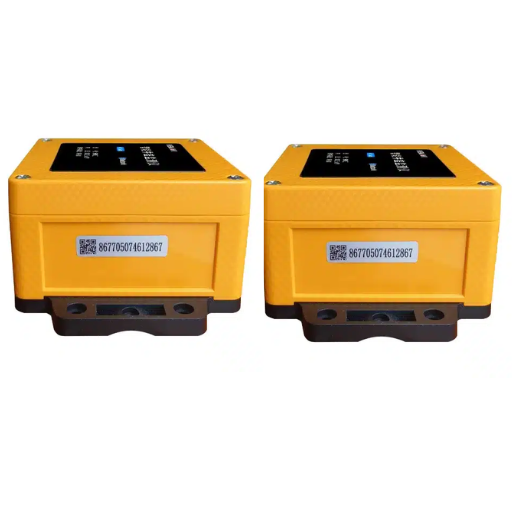
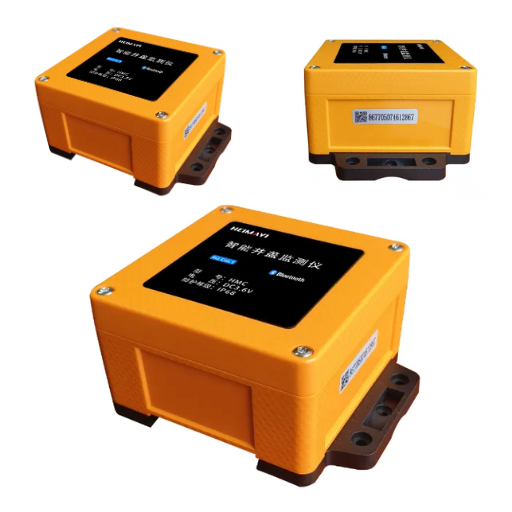
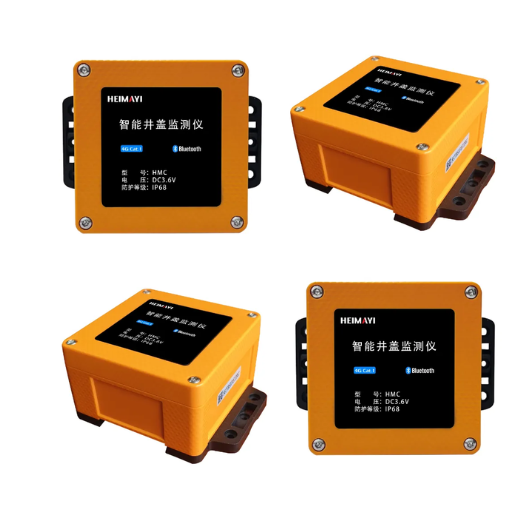
A smart manhole cover basically involves the infusion of IoT sensors together with wireless connectivity into a conventional manhole cover, which is meant to monitor the technological measurements of tilt, level of water, concentration of gas, and temperature in real-time. In case of any technical bad happening, these alerts are transmitted via NB-IoT or LoRaWAN to a central platform.
So, the costs borne for the hardware are only a part of the script on the manufacturer’s quote forms.
Hardware Costs by Sensor Configuration
|
Configuration |
Sensors Included |
Cost per Unit |
Best For |
|---|---|---|---|
|
Basic |
Tilt, magnetic (open/close) |
150−150−250 |
Theft monitoring, low-risk corridors |
|
Standard |
Tilt, magnetic, water level |
300−300−450 |
Flood zones, overflow-prone districts |
|
Comprehensive |
Tilt, magnetic, level, gas (CH4, H2S, O2), temp/humidity |
450−450−650 |
High-risk industrial zones, confined-space entries |
BlackAnt’s smart manhole covers come with high-level IP68, potentially a full complement of gear providing tilt, magnetic, water level, gas, and temperature/humidity sensors as well as LoRaWAN/NB-IoT connectivity. Real-time alerts go directly to the central platform to show on a mobile app.
The smart manhole cover product range is designed for exactly these municipal deployments.
Installation and Deployment Costs
Installation adds approximately 30-40% to the material cost. For a complete unit that costs $500, assume fabricated costs on the order of $650-$700 a unit under expenses like:
- Site survey and GPS mapping
- Sensor mount or integrated cover replacement
- Antenna placement for subsurface signal penetration
- Platform onboarding or initial calibration
Retrofit sensor kits that mount on existing covers cost between 40% and 60% less than new integrated smart covers. It is ideal for pilots and high-risk locations. New installations offer superior antenna placement, vandal protection, and united warranties.
Recurring Operating Costs
The sensor is the cheap part. Over a 10-year lifecycle, the recurring costs add up:
|
Cost Item |
Annual per Unit |
Notes |
|---|---|---|
|
NB-IoT data plan |
12−12−24 |
Varies by carrier and reporting frequency |
|
Platform licensing |
18−18−36 |
Cloud dashboard, alert management, GIS integration |
|
Cybersecurity |
12−12−18 |
Encryption, firmware updates, vulnerability management |
|
Battery replacement |
5−5−10/year averaged |
25−25−50 every 3-5 years |
|
Maintenance and cleaning |
8−8−15 |
Annual sensor verification and enclosure cleaning |
Total 5-year OpEx per unit: 275−275−515.
Total Cost of Ownership
For a sound and good manhole cover implementation, its five-year TCO of 950 to 1215 per unit would suffice, as a ten-year TCO of about 1225 to 1730 per unit would do. These figures derive from conservative, expected for them end. If the ROI is high, it will be a lot of enhancing value to integrate a manhole cover, i.e., for example, putting dollars figures in the millions.
Where the Savings Come From
Now speaking of the counterpart. Smart manhole covers will lead to savings in five major areas. For building the business, we’d like to use the commiserate savings at their lower bounds.
Prevented Sewer Overflows
This is by far the largest factor for investment return. The U. S. EPA figures from 23,000 to 75,000 sanitary sewer overflows (SSOs) per year in the United States. A single combined sewer overflow (CSO) event costs as much as:
- Immediate cleanup: $10,000 to $50,000
- Environmental remediation: $25,000 to $100,000+
- EPA regulatory penalties: $100,000 to $1,000,000 for repeat offenders under the Clean Water Act
Smart level sensors are capable of giving warnings of overflows two to six hours in advance. With such information crews could remove blockages or divert flow to prevent discharges. Tokyo’s metropolitan pilot program showed an 83% reduction in overflow incidents. Simply averting two significant overflow events within a 500-service-residence district per annum would seem to completely counterbalance advanced deployment costs.
Mini-story: Phoenix, Arizona. The city’s water services department deployed smart manhole monitoring along high-risk sewer corridors. The manual inspection hours fell by 67% within a span of 18 months. The two thousand three hundred hours that it pulled back were put into direct targeted repair objectives. This alteration saved about $2.3 million of the annual operating budget. The complete payback for bare capital in instrumentation was within fourteen months maximum.
Labor and Inspection Cost Reduction
Traditional inspection programs are expensive. For a city managing 10,000 manholes with a 20% annual inspection rate at $150 per visit:
- Scheduled inspections: 2,000 visits x 150=∗∗150=∗∗300,000/year**
- Condition-based smart program: 500 targeted alerts x 150=∗∗150=∗∗75,000/year**
- Annual labor savings: $225,000
The change isn’t about killing jobs of existing employees but more about the job relocation process. Their shifts up from routine and somewhat unproductive patrols needing to check items that they actually suspect to nab the most efficient or numerous vehicles of those most under-suspicion (that have proven to be suspicious). Each and every trip directly addresses an issue or potential issue. The industrial IoT benchmarks appear to the tune of a 30%-50% reduction in inspection costs.
Asset Life Extension
Preventive maintenance prevents catastrophes rather than responding to them. Early identification of frame stress torque, corrosion, or fluidic anomalies incites immediate repair.
- Early manhole frame maintenance will cost approximately ~$2,000.
- Forge-ahead structures and surrounding pavement might need restoration and reconstruction; costs might reach 15,000−25,000.
- road closure and traffic management: the cost might be an additional 5,000−15,000.
Hamburg’s Smart City has effectively brought the time of road closures down by 41% via IoT-based monitoring of sewers. More time with streets open means less disruption, fewer traffic accidents, and fewer premiums for emergency contracting.
Safety and Liability Cost Avoidance
Gas detection inside manholes will prevent disasters due to confined spaces before they can manifest. In Chicago, methane detection alerted for actual potential explosions three times in one year, saving $18 million in property damage and liability claims.
Tilt and magnetic sensors monitor for cover removal in concert. Swift police intervention with cover thieves could prevent humans from falling into the manhole. Open-manhole liability settlements from U. S. municipalities are typically $75,000 to $500,000.
Theft and Unauthorized Access Recovery
Stolen scrap metal of manhole covers costs municipal governments millions of dollars each year. When police arrived within minutes rather than days due to being alerted of an actual displacement in real time, the owner could recover the lifted covers and receive additional deterrence through responding forces, lowering the overall costs of replacement.
Want to see how a smart manhole cover system would fit your specific infrastructure risk profile? Explore Black Ant’s IP68 smart manhole cover solutions with integrated NB-IoT/LoRaWAN connectivity and real-time alert management.
The ROI Calculation: Three Municipal Scenarios

Here are three worked examples using conservative cost assumptions and lower-bound savings. If the numbers work here, your actual results will likely be better.
Scenario A: Pilot Deployment (50 Covers, High-Risk Flood Zone)
|
Item |
Cost |
|---|---|
|
Hardware (50 x $500 comprehensive) |
$25,000 |
|
Installation (50 x $150) |
$7,500 |
|
Platform integration (18% of subtotal) |
$5,850 |
|
Total CapEx |
$38,350 |
|
Annual OpEx (5-year average) |
$10,300 |
Annual savings:
- Prevented overflows (1 event at 47,000):47,000):47,000
- Labor reduction (25% of pilot-area inspection budget): $18,750
- Early repair vs catastrophic failure (2 events): $26,000
- Total annual savings: $91,750
Payback period: 5.0 months
5-year NPV at 3% discount rate: $374,000
A pilot this small is not about scale. It is about proof. Fifty units in your highest-risk zone generate an internal case study you can take to city council with real numbers from your own infrastructure.
Scenario B: District Rollout (500 Covers, Mixed Urban Infrastructure)
|
Item |
Cost |
|---|---|
|
Hardware (500 x $450 standard) |
$225,000 |
|
Installation (500 x $135) |
$67,500 |
|
Platform integration + GIS onboarding (20% of subtotal) |
$58,500 |
|
Total CapEx |
$351,000 |
|
Annual OpEx (5-year average) |
$82,500 |
Annual savings:
- Prevented overflows (4 events at 47,000):47,000):188,000
- Labor reduction (full district reallocation): $150,000
- Asset life extension (15 early repairs vs failures): $195,000
- Safety/liability avoidance (1 major incident): $75,000
- Total annual savings: $608,000
Payback period: 7.0 months
5-year NPV at 3% discount rate: $2,450,000
At district scale, economies of efficiency kick in. You are not just preventing incidents. You are reshaping how your public works department operates.
Mini-story: The Fond du Lac Difference. Fond du Lac, Wisconsin was confronted with chronic SSO events in a downtown commercial district on a very old combined sewer. So, the utility plugged 45 smart manhole monitors in the most hazardous part of the grid in order to eliminate as many as three water releases in the opening wet season. Each prevented event was calculated to be in the range of $35,000−$35,000−$60,000 cleanup and regulatory costs. The system paid for itself in 11 months. More importantly, the public works director now had data to show to the council members: Real-time level graphs, alert response timestamps, and seasonal comparisons of events were made during the season for deciding purposes in favor of elongated expansion.
Scenario C: City-Wide Scale (10,000 Covers, Full Network)
|
Item |
Cost |
|---|---|
|
Hardware (10,000 x $400 blended average) |
$4,000,000 |
|
Installation (10,000 x $120) |
$1,200,000 |
|
Platform integration + GIS + SCADA (22% of subtotal) |
$1,144,000 |
|
Total CapEx |
$6,344,000 |
|
Annual OpEx (5-year average) |
$1,375,000 |
Annual savings:
- Prevented overflows (25 events at 47,000):47,000):1,175,000
- Labor reallocation (full city inspection program): $2,250,000
- Asset life extension (200 early repairs): $2,600,000
- Safety/liability/theft (5 major incidents): $375,000
- Total annual savings: $6,400,000
Payback period: 12.0 months
5-year NPV at 3% discount rate: $24,100,000
At city-scale, the per unit economics get even better. Lower costs are driven by higher volumes of sales, shared platform infrastructure, and dispatch routing efficiency. The ‘Return To Cost’ period is thus a bit longer than seven years because not every single manhole has the same risk associated with it. However, the return is significant.
|
Scenario |
Units |
CapEx |
Annual Savings |
Payback |
5-Year NPV |
|---|---|---|---|---|---|
|
A: Pilot |
50 |
$38,350 |
$91,750 |
5 months |
$374,000 |
|
B: District |
500 |
$351,000 |
$608,000 |
7 months |
$2,450,000 |
|
C: City-Wide |
10,000 |
$6,344,000 |
$6,400,000 |
12 months |
$24,100,000 |
Hidden Costs Most Budgets Miss
Most smart city ROI projections fail because they inflate benefits and hide recurring costs. Here is what experienced project managers account for.
Platform Integration and GIS Onboarding
Connecting sensor data to your existing asset management system consumes 18-22% of total project budget. This is not optional. A sensor that generates alerts nobody receives is wasted capital.
Budget for:
- GIS asset mapping and coordinate verification
- SCADA or work-order system API integration
- Alert threshold configuration and escalation workflows
- Mobile app deployment to field crews
Cybersecurity and Firmware Management
Municipal IoT devices are prone to higher cyber-attack risks. Budget for $12−$18 per device is crucial for getting encryption certificates, firmware update distributions, and vulnerability monitoring. A compromised network of sensors is worse than no network at all.
Change Management and Employee Training
Field workers need training for alert response protocols. Dispatchers need to understand new workflows. Managers need to go through a dashboard literacy session. Underestimating change management is typically the most common cause of IoT deployment underperformance in year one.
Go intranode coverage gaps
NB-IoT coverage is great over most urban areas, so verify underground penetration at your specific sites. You may need to put repeaters or LoRaWAN gateways at basements, tunnels, and deep manholes. Test, and then do to scale that.
The contrarian truth: the sensor is the cheap part. Integration, training, and sustained operation would determine whether the smart manhole cover will live up to the ROI on the spreadsheet.
Maximizing ROI: Deployment Best Practices

Start Where the Risk Is Highest
Do not deploy evenly across your network. Identify your top 10% risk locations: flood zones, overflows history, heavy foot-traffic areas, industrial discharge points, and aging trunk sewers. A 50-unit pilot in your highest-risk zone delivers more measurable ROI than 500 units spread thin.
Match Sensor Profile to Risk Profile
Not every manhole needs every sensor. Basic tilt monitoring is sufficient for low-risk residential areas. Comprehensive gas and level sensing belongs in industrial zones and combined sewer overflow points. Over-specification wastes budget. Under-specification misses incidents.
Connectivity Economics: NB-IoT vs LoRaWAN at Scale
|
Factor |
NB-IoT |
LoRaWAN |
|---|---|---|
|
Upfront infra cost |
Low (uses carrier networks) |
Moderate (gateway investment) |
|
Annual per-device cost |
12−12−24 |
2−2−8 (after gateway) |
|
Break-even scale |
Under 1,000 devices |
Over 1,000 devices |
|
Underground penetration |
Excellent (cellular deep indoor) |
Good (requires gateway proximity) |
|
Best for |
Pilot to district scale |
City-wide and campus networks |
Black Ant smart manhole covers support both NB-IoT and LoRaWAN out of the box, so your connectivity decision can evolve with scale.
Leverage Existing Platforms
Integrate with your existing GIS and work-order systems rather than buying new dashboards. Black Ant’s IoT data collection terminals support MQTT, REST API, and Modbus bridges for direct integration into municipal SCADA and asset management platforms.
Pilot Before Scaling
A proof of concept usually referred to as a 50-50 unit exploits three magical things-plots: internal case study data, testing of crew workflows, and integration architecture proof. It is impossible to propose city-wide deployment based on pilot data from any other source when your own infrastructure pilot still has to be completed.
Building the Business Case for Budget Approval
Talking Points for City Council
- “Smart manhole covers also provide early warning for infrastructure failures and unused expenses.”
- “Each sewer overflow averted saves between $47,000 and $150,000 in cleaning, fines, and remediation. These small tests cost a cumulative $38,000.”
- “It will transfer our field teams from the gas-guzzling daily routine, where they end up finding zero ninety percent of the time, to verified repairs with exact locations and sensor data.”
- “From our imperiled track track, the payback will be less than one year. Each saving made, thereafter, will return into the general fund.”
- “We’re not replacing staff, for instance, we just want to give them something to wrench on rather than windshield time.”
Grant Application Language
Manhole smart monitoring falls under a number of funding sources from the various federal and state levels:
- Environmental Protection Agency – Clean Water State Revolving Fund: Infrastructure aimed at reducing SSO incidents and controlling CSOs
- Federal Emergency Management Agency Hazard Mitigation- Flood Mitigation and Disaster Risk Reduction
- Smart City Challenge from the Department of Transportation: IoT infrastructure for transportation-operational utility corridors
- State environmental compliance grants: Technology-based solutions that may be paired with decree milestones
Propose this project on the basis of its outcomes: “The project will reduce SSO incidents by X%, create Y hours in productive use of labor, and offer data acquired by environmental monitoring during the time frame of Z for continuous compliance.”
Risk Framing: Cost of Doing Nothing
Deferred maintenance does not stay deferred. It compounds.
An unmonitored manhole frame that costs $2,000 to repair today becomes a $20,000 street reconstruction in three years. An undetected blockage today becomes a $47,000 overflow during the next storm.
The cost of doing nothing is not zero. It is deferred, amplified, and ultimately more expensive.
Mini-story: The Budget Cycle Trap. Director Elena Morales of the Northern Moraine Sewerage District put off smart manhole monitoring for three budget cycles. “It was always the next year’s priority,” she remembered. In year two, a trunk sewer blockage caused a 200,000-gallon overflow into a residential neighborhood. Cleanup, EPA reporting, legal settlement, and mandated infrastructure upgrades cost $1.8 million. The smart monitoring system she had priced at $180,000 would have detected the blockage 4 hours earlier. “We spent ten times the prevention cost on one failure. That mistake changed how we budget for infrastructure.”
Ready to build your own ROI model? Contact Black Ant’s engineering team for a pilot deployment assessment and customized cost-savings projection based on your infrastructure inventory.
Frequently Asked Questions

What is the typical payback period for smart manhole covers?
Payback typically ranges from 5 to 18 months for pilot deployments in high-risk zones, and 12 to 36 months for city-wide rollouts. The payback period depends on your incident history, labor costs, and regulatory exposure. Municipalities with EPA consent decrees or high overflow frequency see the fastest returns.
How much does a smart manhole cover cost per unit installed?
Units for all tilt, level, gas, and environment sensors run a hardware + installation range of $450-$650 and $120-$180, respectively. $570-$830 is the total sum for one unit. Basic tilt-only configurations are valued at $200-$350 installed. Recurrent costs will include $55-$103 for annual support per unit.
Can a small municipality afford smart manhole monitoring?
Yes. Installed costs would be $16,000 or less for the pilot program with 20 units situated in your most risky area. This is less than the cost to prevent even one CSO event. A great many smaller municipalities kick off with grant-funded pilot programs and expand their programs based on documented savings.
How do the smart manhole covers reduce maintenance labor costs?
They substitutes scheduled for condition-based dispatch. Instead of inspecting 20 percent of manholes according to some fixed schedule on a calendar year and year, the crews will respond only to alerts. Ultimately, this can reduce inspection labor costs 30 to 50% and, at the same time, enhance incident detection considerably.
How is the price of only one sewer overflow event?
Such events come up to about $10,000 and $50,000 for immediate cleanup. An additional $25,000 and $100,000 for environmental remediation is usually required. Consequences from repeated events could range from $100,000 to $1,000,000. The costs associated with eliminating such an overflow, though, often provide a substantial amount of the environment to invest in a demonstration project.
How does scale affect the per-unit cost?
At pilot scale (less than 100 units), the highest cost per unit is possible due to fixed platform and integration overheads. From 500 to 2,000 units, district scale will have cost advantages of volume pricing and shared infrastructure of 15 to 25% lower costs per unit. For a city-wide deployment in the range of 5,000+ units, paring down the cost by 30-40% can be done through LoRaWAN private networks and bulk procurement.
What hidden costs should municipalities remember?
Hardware should also accommodate training staff, battery replacement every 3-5 years, cybersecurity taxes for the $12-18/device/year (32%-44% of the project cost), and connector plans. TCO is generally a range of 2.0-2.5x the hardware cost in five years.
Conclusion: Five Key Takeaways
The business case rests upon the return on investment for intelligent manhole covers is thus very easy to grasp: any failure beneath the earth is already indicative of an expense. Smart monitoring can make them preventable.
- The cost is a non-issue. A broad set of smart manhole covers will be installed at costs of $570−830, with the 5-year end-of-life TCO standing at below $1,215 per unit. This is less expensive than that which would be spent preventing an overflow.
- Payback is fast. Pilot deployments in high-impact areas will pay back within 5-18 months. Rollouts of complete districts will typically pay back within the first year.
- And the savings are genuine and conservative. Our scenarios are based on the most conservative savings estimates. Phoenix, Tokyo, and Hamburg have all exceeded these standards.
- Hidden costs might kill deployment. Integration, cybersecurity, the change management needed to let the project succeed are vital considerations. Budget for these concerns while putting together the project business case.
- Start small and yield value, then grow. A 50-unit pilot enables the acquisition of internal-case-study data which completely supports the city-wide business case.
In a shift from reactive to predictive and data-powered asset management, money is moving to infrastructure. Smart manholes are the most strategic first touchpoint for such an evolution. To learn more about smart manhole covers, please read: Smart Manhole Covers: A Complete Guide to IoT-Enabled Urban Infrastructure
It is very precise in what it is, very measurable in costs, very fast and near-term payouts in its environment, as opposed to some twenty or thirty years, by which time who knows what would be left and what new solutions would have come out. To learn more about Smart Manhole Cover OEM Manufacturer China and Sewer Flood Prevention with IoT Monitoring, please click to refer to our accompanying guide.
If you are evaluating smart manhole monitoring for your municipality or utility, download Black Ant’s smart manhole cover technical datasheet or contact our engineering team for a pilot deployment assessment. We will walk through your infrastructure inventory, identify your highest-risk zones, and build a conservative ROI projection you can take to your next budget review with confidence.