Manhole Digital Twin GIS: From Map to Live Sewer Simulation
A map tells you where the manholes are. A model tells you what the water is doing inside them. A manhole digital twin tells you what it will do next, and that is the only question a council actually funds.
Most sewer monitoring programmes stop at the map. They have assets plotted, sensors reporting, and a dashboard that shows the present. What they cannot do is predict. Every storm is still a surprise, and every capital decision is still a guess dressed up as a plan.
The gap isn’t more sensors. It’s the model layer that turns live readings into foresight. A manhole digital twin is a spatially aware virtual replica of a sewer network, continuously updated by field telemetry and coupled to a hydraulic model, so the network can be watched and its near-future behaviour simulated in the same place.
By the end of this guide you’ll be able to say what a manhole digital twin actually is, why GIS is the backbone it cannot do without, how live telemetry couples to a hydraulic model and why calibration is what makes it a twin, which rung of the map to monitoring to model to twin ladder you are standing on and which one you can fund, the what-if questions a twin answers for a capital decision, and the five ways twins fail. For the architecture that delivers sensor data to that layer, our field-to-map GIS integration guide covers the plumbing this article assumes.
Planning the model layer this quarter? Download the Manhole Digital Twin Readiness Kit → It carries the maturity-ladder worksheet, the minimum sensor-set checklist and the what-if scenario planner described below.
What a Manhole Digital Twin GIS Actually Is
A manhole digital twin is a spatially aware virtual replica of a sewer network, continuously updated by live field telemetry and coupled to a hydraulic model, so the network can be observed and its near-future behaviour simulated in one place.
Three ingredients make it work. The spatial asset layer holds where everything is. The live telemetry carries what is happening right now. The hydraulic model explains why it is happening and what happens next. Remove any one and you no longer have a twin.
The distinction from plain IoT monitoring is the model. Monitoring reports what already happened. A twin predicts what is about to. The distinction from a dashboard is the same line seen from the other side. A dashboard reads the present, and a municipal GIS dashboard for sensor data is built to give a director the few numbers a decision needs. A twin simulates futures the dashboard hasn’t seen yet. The twin feeds the dashboard; it isn’t one.
The manhole is the right unit for this for a specific reason. It’s where the sensors sit, where crews gain access, and where problems surface first, whether that’s a lifted lid, a gas reading, or a rising level. It’s the atom of the network, and the honest place to anchor a twin.
Manhole Digital Twin GIS: The Spatial Backbone
GIS is the authoritative spatial spine of a twin, because a hydraulic model is a topology before it’s anything else. Every pipe and manhole, its geometry and its attributes, lives in one traceable graph. Get the connectivity wrong and the simulation is wrong, no matter how good the sensors are.
This is why geography is load-bearing rather than decorative. On a map, a misplaced manhole is an eyesore. In a model, it’s a wrong answer. A pipe connected to the wrong node reroutes flow in the simulation exactly as it would in the ground, and the twin forecasts a flood in the wrong street.
The identity rule carries over from every other layer of a monitoring programme. A twin can only simulate what it can name. The same FACILITYID discipline the work-order loop depends on is what lets a telemetry reading attach to the asset the hydraulic model is solving for. If the asset attributes are incomplete, the model is fiction, which is why the manhole asset management GIS data model is the first thing to get right.
The most common failure is the static GIS. As the Anvil Labs work on digital twins and GIS for sewer systems describes it, traditional GIS is more static than real time, updated when someone inspects rather than when something changes. A GIS that only moves on inspection is a twin frozen in time. The twin needs live telemetry to be a twin at all.
The manhole is where that live signal carries the highest value. Tilt, lid state, level and gas all resolve at the manhole before they resolve anywhere else, which makes it the twin’s most important node and the natural place to start instrumenting.
Coupling Live Telemetry to a Hydraulic Model
The phrase “digital twin sewer network GIS integration” sounds abstract until you split it into its two halves. There’s a model, which is physics, and there’s telemetry, which is measurement. The twin is what happens when the second continuously corrects the first.
The model is a hydraulic or hydrodynamic engine. Open engines such as the USEPA Storm Water Management Model (SWMM) solve the network in the public domain, which is what makes a low-budget twin real. Commercial engines such as InfoWorks ICM, Bentley OpenFlows SewerGEMS and DHI MIKE+ solve it at enterprise scale. The engine isn’t the twin; it’s the physics the twin runs on.
The telemetry is the measurement that keeps the model honest. An uncalibrated model is an educated guess, and calibration is what turns a model into a twin. It’s also the step most programmes skip.
Magdeburg runs a SWMM 5.2 model of more than 7,000 nodes against real rain data. Warsaw drives an online hydraulic simulation from roughly 100 water-level sensors, updates control elements every second, and produces a two-hour prognosis every fifteen minutes. Neither is possible without the coupling.
Data assimilation is the discipline that holds it together. Live readings are fed into the model, the model’s current state is corrected, and its parameters re-estimated. The twin is only as current as its last assimilation. A model calibrated once and never re-fed isn’t a model; it’s a memory, and it drifts as the network changes around it.
The Marlow Vale Water Authority learned the difference between a model and a memory. The authority runs around 2,600 covers, with roughly 600 instrumented, and its GIS was complete but static. Its real problem sat in a corner: a hydraulic model last calibrated in 2019, living in a spreadsheet nobody had opened since. The network modeler, Priya Raman, knew it had drifted. The trunk that flooded every spring was the same trunk the 2019 model scored as adequate.
Wiring a handful of existing level sensors into that model and re-calibrating against two real storms changed the answer. The first honest surcharge forecast arrived from a calibrated model, not from a finished twin, and it was enough to justify a maintenance intervention before the season began.
The sensor set that makes this possible is smaller than most programmes assume.
| Sensor | What it measures | Where | Why the model needs it |
|---|---|---|---|
| Level sensor | Water depth in the pipe | A key manhole, ideally a control point | Sets the model’s boundary condition and reveals surcharge |
| Flow monitor | Velocity and discharge | A trunk or trunk-adjacent manhole | The calibration target the model is tuned against |
| Rain gauge | Rainfall intensity | In the contributing catchment | The model’s driver; without it there is nothing to solve for |
| Gas / tilt sensor | CH₄, H₂S, lid movement | At the manhole itself | Asset condition the physics model cannot see |
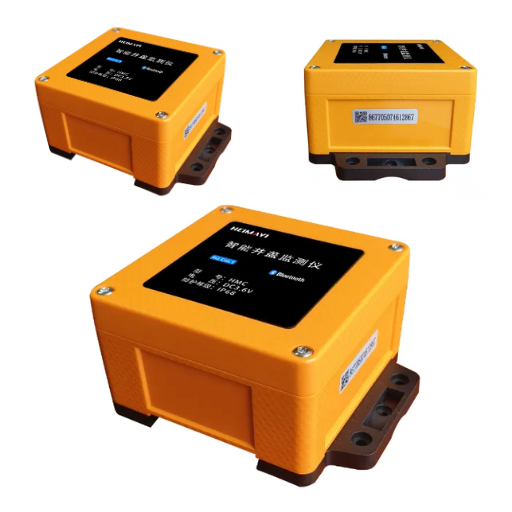
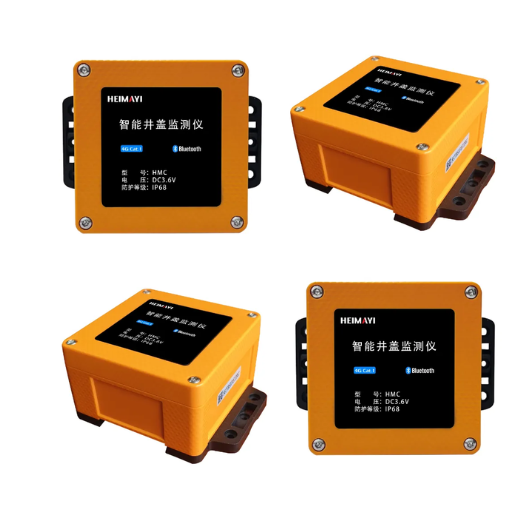
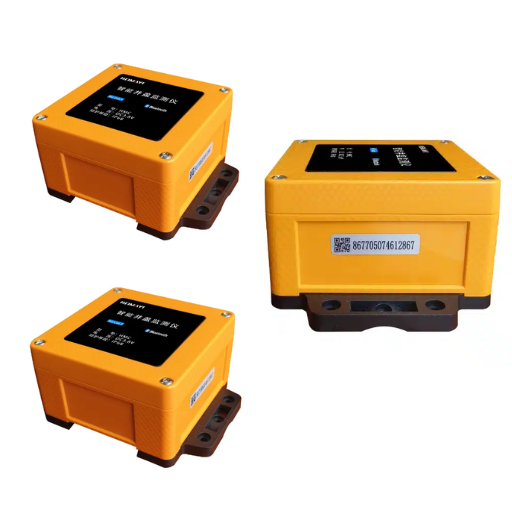
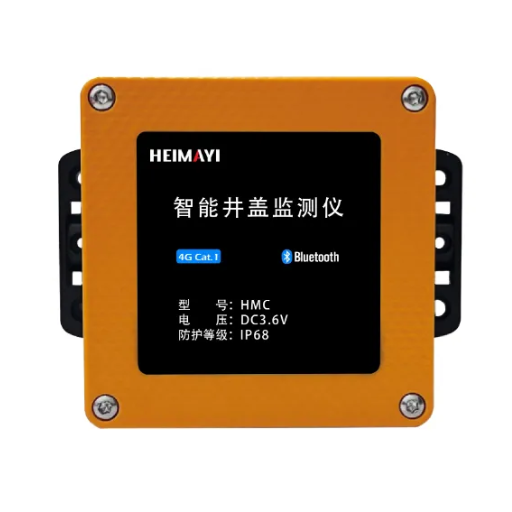
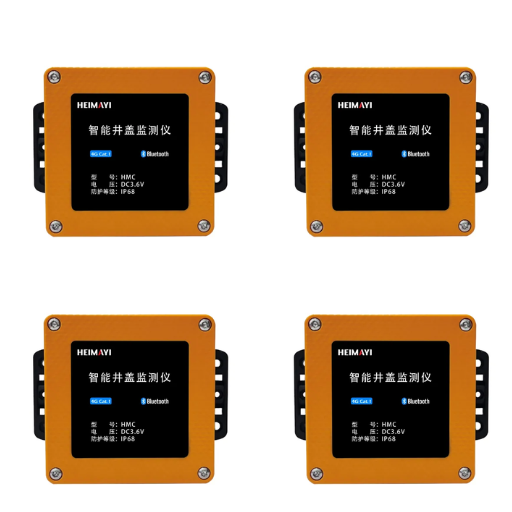
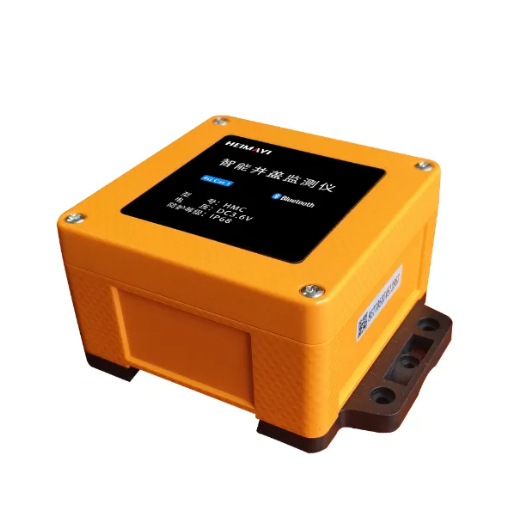
Two of those rows are the ones programmes forget. Rain is what the model is calibrated against, and gas and tilt describe condition the hydraulics alone will never surface. Keeping the feed supplied from the node itself is what the Smart Manhole Cover does, reporting tilt, lid-open, water level and gas from the manhole the model is solving for.
There’s an honest choice inside the model layer, too. Physics-based models are the default, but they aren’t always best. Autodesk reports that artificial neural networks outperformed physics-based modelling for sewer flow prediction in a Ballarat, Victoria case. The pragmatic answer is to use the physics model for the network you understand and a data-driven model where the hydraulics are too complex or too cheaply instrumented to trust.
Want to see the coupling on your own network? Talk to our application engineers → about feeding the sensors you already own into a hydraulic model.
The Manhole Digital Twin GIS Maturity Ladder: Map → Monitoring → Model → Twin
No vendor sells a digital twin. You climb to one. The category’s most expensive mistake is treating a twin as a product rather than a maturity, and buying the top rung before standing on the ones below it.
Bentley frames this as “the latest rung on the ladder of digital evolution”, running from paper maps to computerised hydraulic models to integrated operations to a holistic twin, and stresses that the underlying technology needs to stay open. The value is in publishing that ladder as a decision, not a slogan, so a municipality can see which rung it already holds.
| Level | What you have | What it unlocks | Typical tooling |
|---|---|---|---|
| 0 · Map | Assets, geometry and attributes in a GIS | A traceable asset record and a topology to model | ArcGIS, QGIS/PostGIS |
| 1 · Monitoring | Live telemetry on a feature layer | Visibility, alerts and a history to calibrate against | Sensor feed + GIS |
| 2 · Model | A calibrated hydraulic model fed by live telemetry | Surcharge and overflow forecasts you can act on | EPA SWMM, InfoWorks, SewerGEMS |
| 3 · Twin | Continuous assimilation, forecasting and what-if simulation | Scenario planning and prioritised capital decisions | ICMLive, OpenFlows + iTwin |
At Rung 1, the goal is a clean, trustworthy feed rather than a forecast. Pinewood Water Utility, with 4,200 covers and 800 instrumented on ArcGIS Online and Cityworks, is the monitoring tier done well, and it’s what makes the next rung possible at all. Without a reliable history, there’s nothing to calibrate against.
At the top, a federated twin isn’t theoretical. Águas do Porto’s H2PORTO programme, built on Bentley OpenFlows, integrates 22 data-source types across water supply, wastewater, stormwater and coastal systems. The vendor reports a 3.5% drop in non-revenue water and 22.9% fewer water-supply interruptions, figures worth reading as vendor-reported rather than independently audited.
The contrarian rule is to resist skipping rungs. A twin built on a bad model is expensive fiction, because continuous assimilation only sharpens whatever the model already says. Most municipalities get their first real result at Rung 1 and their first forecast at Rung 2, not at the top. The point of the ladder isn’t to reach the summit. It’s to name the rung you’re on and the one you can fund next.
What-If Scenario Planning: What a Sewer Digital Twin Answers
A twin is a laboratory. It lets you run the storm before it arrives, and that’s where monitoring turns into a decision rather than a stream of numbers.
The difference between an observation and a forecast is the difference between “we think it will flood” and “here is the extent, the depth and the timing”. Coupling the model to a weather forecast is what produces the second. Autodesk reports that Aguas de Alicante couples a hydraulic twin with rainfall forecasts to predict flooding extent and timing, and that’s the watershed move for the reader: the model stops describing the past and starts describing the next six hours.
| Scenario | Question it answers | Data in | Output |
|---|---|---|---|
| Design storm | Will this trunk surcharge? | Catchment geometry, model, design rainfall | Surcharge points and depth |
| CSO / basement flooding | Where does it overflow, and how often? | Model + telemetry + history | Overflow frequency by location |
| New development | Does the network have capacity? | Proposed inflow, current model | Capacity headroom at each node |
| Sensor placement | Where is the network still blind? | Model sensitivity + existing sensors | The next sensors worth buying |
| Maintenance | Which manhole feeds the pinch point? | Model + asset condition | A ranked intervention list |
That last row is the quiet one. The twin doesn’t only forecast water; it prioritises work, and it hands a ranked list to the maintenance schedule. Kansas City’s “Smart Sewer Digital Twin” is built on exactly that premise, turning disparate sensor data into sewer-system intelligence a team can act on. When the model identifies the intervention, the mechanics of raising and closing the work order are the GIS and CMMS work-order integration loop. The twin decides what to do; the work-order system does it.
A year after re-calibrating its model, Marlow Vale added a design-storm scenario. For the first time the authority answered “which trunk floods first” weeks before the storm, not in a damage report after it. The full twin at Rung 3 remains its aspiration, and that’s the point worth repeating. The value arrived at Rung 2.
The low-budget path is real, and it isn’t a compromise. A municipality that can’t fund an enterprise suite runs the same scenarios on EPA SWMM driven by a GIS it already owns, which is the open-source build our QGIS, GeoServer and PostGIS guide for real-time sensor data covers end to end. Tallinn’s smart-city solution runs a GIS-based twin on USEPA SWMM, fed by sensors transmitted over LoRa to gateways in manholes. The model-first tier doesn’t require a large-utility budget. It needs a model and a few honest sensors.
Five Ways a Digital Twin Fails
Every failed twin fails in one of five ways, and each is a decision made long before the model was built.
- GIGO asset data. Missing invert levels, diameters and slopes make the model fiction. The least glamorous rung, the map, decides whether the twin is real. Start there.
- Uncalibrated drift. A model calibrated once and never re-fed decays as the network grows and changes. Without continuous assimilation, the twin drifts back into a guess.
- Telemetry gaps. A dead sensor silently blinds the twin, and now the blindness has hydraulic consequences. A stale device must never read as normal.
- The 3D-twin trap. A beautiful visual replica with no hydraulic model behind it is a screensaver with a modelling budget. If it can’t run a scenario, it isn’t a twin.
- No owner and no metric. A twin with no named modeler and no decision it drives is a project, not a capability. It won’t survive its first budget review.
Four of those five are the same failure wearing different clothes. The twin was treated as a purchase rather than a discipline, and the discipline is what the ladder maps out one rung at a time.
Conclusion: Start at the Rung You Can Hold
A manhole digital twin is a spatial, live, calibrated and predictive replica of a sewer network. GIS is its spine, telemetry is its pulse, and the hydraulic model is what turns both into foresight. It’s a maturity, not a product, and the ladder runs map to monitoring to model to twin.
The value arrives earlier than the name suggests. Most municipalities get their first honest forecast from a calibrated model fed by a handful of sensors, not from a finished twin. The top rung is the destination, not the entry fee.
Two moves this quarter will put you on the right rung. First, confirm the asset attributes the model needs, invert levels, diameters and slopes, are recorded against the asset. Second, pick the one scenario you’d fund tomorrow and ask whether your current data could answer it. If it can’t, you’ve found the next sensor worth buying.
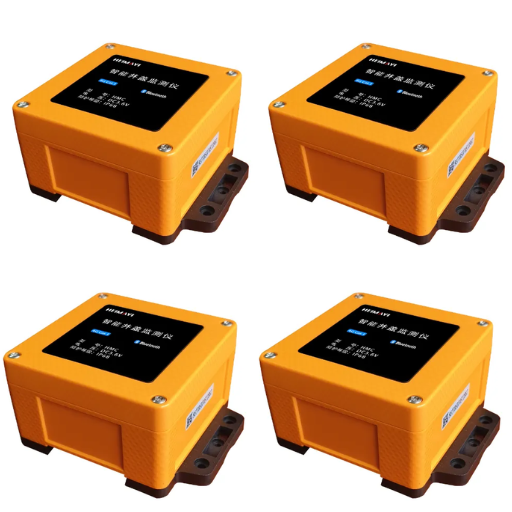
Download the Manhole Digital Twin Readiness Kit for the maturity-ladder worksheet, the minimum sensor-set checklist and the what-if scenario planner. The devices behind every reading on it are the ones we build: the Smart Manhole Cover reports the node condition, and the IoT Data Collection Terminal aggregates and classifies events before they reach your model. Read the field-to-map GIS integration guide for the architecture around them, or talk to our application engineers about climbing to the rung you can hold.